Monitor Nvidia Jetson GPU
We have many mobile edge computer(mec)s, which have nvidia jetson gpu, we want to monitor the gpu status with prometheus and grafana.

What we have done as the following steps:
- build custom jetson gpu exporter to collect gpu status
- prometheus scrape the metrics from the gpu exporter, store it in tsdb
- create custom grafana dashboard to show the metrics in prometheus
Build custom jetson GPU Exporter
After search I found svcavallar/jetson-stats-grafana-dashboard on github. But it doesn’t match my requirements, since
- Now jetston-stats is
4.2.3, which has lot change and diff from old version. We should change the filed get from the package. - We want to get the processes info that using gpu currently.
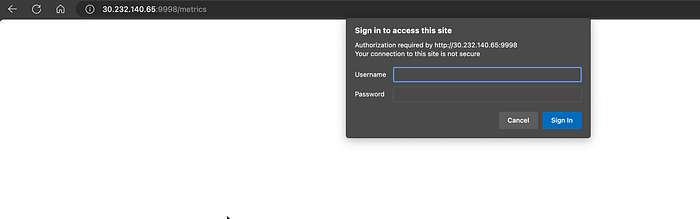
- We want to add basic auth to our
/metricsroute to improve our security. - Prefer docker image in cloud native way than systemd service on host.
So we fork the repository to taozhi8833998/jetson-stats-grafana-dashboard, and add the above feature to the exporter.
#!/usr/bin/python3
# -*- coding: utf-8 -*-
import atexit
import os
from jtop import jtop, JtopException
from prometheus_client.core import InfoMetricFamily, GaugeMetricFamily, REGISTRY, CounterMetricFamily
from prometheus_client import make_wsgi_app
from wsgiref.simple_server import make_server
from base64 import b64encode
string_to_encode = os.environ.get("USERNAME")+':'+os.environ.get("PASSWORD")
bytes_to_encode = string_to_encode.encode('utf-8')
base64_encoded = b64encode(bytes_to_encode)
base64_encoded_string = base64_encoded.decode('utf-8')
base64_encoded_string = base64_encoded_string.strip()
HTTP_AUTH = 'Basic ' + base64_encoded_string
class CustomCollector(object):
def __init__(self):
atexit.register(self.cleanup)
self._jetson = jtop()
self._jetson.start()
def cleanup(self):
print("Closing jetson-stats connection...")
self._jetson.close()
def collect(self):
if self._jetson.ok():
#
# Board info
#
i = InfoMetricFamily('gpu_info_board', 'Board sys info', labels=['board_info'])
i.add_metric(['info'], {
'machine': self._jetson.board['info']['machine'] if 'machine' in self._jetson.board.get('info', {}) else self._jetson.board['hardware']['Module'],
'jetpack': self._jetson.board['info']['jetpack'] if 'jetpack' in self._jetson.board.get('info', {}) else self._jetson.board['hardware']['Jetpack'],
'l4t': self._jetson.board['info']['L4T'] if 'L4T' in self._jetson.board.get('info', {}) else self._jetson.board['hardware']['L4T']
})
yield i
i = InfoMetricFamily('gpu_info_hardware', 'Board hardware info', labels=['board_hw'])
i.add_metric(['hardware'], {
'codename': self._jetson.board['hardware'].get('Codename', self._jetson.board['hardware'].get('CODENAME', 'unknown')),
'soc': self._jetson.board['hardware'].get('SoC', self._jetson.board['hardware'].get('SOC', 'unknown')),
'module': self._jetson.board['hardware'].get('P-Number', self._jetson.board['hardware'].get('MODULE', 'unknown')),
'board': self._jetson.board['hardware'].get('699-level Part Number', self._jetson.board['hardware'].get('BOARD', 'unknown')),
'cuda_arch_bin': self._jetson.board['hardware'].get('CUDA Arch BIN', self._jetson.board['hardware'].get('CUDA_ARCH_BIN', 'unknown')),
'serial_number': self._jetson.board['hardware'].get('Serial Number', self._jetson.board['hardware'].get('SERIAL_NUMBER', 'unknown')),
})
yield i
#
# NV power mode
#
i = InfoMetricFamily('gpu_nvpmode', 'NV power mode', labels=['nvpmode'])
i.add_metric(['mode'], {'mode': self._jetson.nvpmodel.name})
yield i
#
# System uptime
#
g = GaugeMetricFamily('gpu_uptime', 'System uptime', labels=['uptime'])
days = self._jetson.uptime.days
seconds = self._jetson.uptime.seconds
hours = seconds//3600
minutes = (seconds//60) % 60
g.add_metric(['days'], days)
g.add_metric(['hours'], hours)
g.add_metric(['minutes'], minutes)
yield g
#
# CPU usage
#
g = GaugeMetricFamily('gpu_usage_cpu', 'CPU % schedutil', labels=['cpu'])
g.add_metric(['cpu_1'], self._jetson.stats['CPU1'] if 'CPU1' in self._jetson.stats else 0)
g.add_metric(['cpu_2'], self._jetson.stats['CPU2'] if 'CPU2' in self._jetson.stats else 0)
g.add_metric(['cpu_3'], self._jetson.stats['CPU3'] if 'CPU3' in self._jetson.stats else 0)
g.add_metric(['cpu_4'], self._jetson.stats['CPU4'] if 'CPU4' in self._jetson.stats else 0)
g.add_metric(['cpu_5'], self._jetson.stats['CPU5'] if 'CPU5' in self._jetson.stats else 0)
g.add_metric(['cpu_6'], self._jetson.stats['CPU6'] if 'CPU6' in self._jetson.stats else 0)
g.add_metric(['cpu_7'], self._jetson.stats['CPU7'] if 'CPU7' in self._jetson.stats else 0)
g.add_metric(['cpu_8'], self._jetson.stats['CPU8'] if 'CPU8' in self._jetson.stats else 0)
yield g
#
# GPU usage
#
g = GaugeMetricFamily('gpu_usage_gpu', 'GPU % schedutil', labels=['gpu'])
g.add_metric(['val'], self._jetson.stats['GPU'])
yield g
#
# Fan usage
#
g = GaugeMetricFamily('gpu_usage_fan', 'Fan usage', labels=['fan'])
g.add_metric(['speed'], self._jetson.fan.get('speed', self._jetson.fan.get('pwmfan', {'speed': [0] })['speed'][0]))
yield g
#
# Sensor temperatures
#
g = GaugeMetricFamily('gpu_temperatures', 'Sensor temperatures', labels=['temperature'])
keys = ['AO', 'GPU', 'Tdiode', 'AUX', 'CPU', 'thermal', 'Tboard']
for key in keys:
if key in self._jetson.temperature:
g.add_metric([key.lower()], self._jetson.temperature[key]['temp'] if isinstance(self._jetson.temperature[key], dict) else self._jetson.temperature.get(key, 0))
yield g
#
# Power
#
g = GaugeMetricFamily('gpu_usage_power', 'Power usage', labels=['power'])
if isinstance(self._jetson.power, dict):
g.add_metric(['cv'], self._jetson.power['rail']['VDD_CPU_CV']['avg'] if 'VDD_CPU_CV' in self._jetson.power['rail'] else self._jetson.power['rail'].get('CV', { 'avg': 0 }).get('avg'))
g.add_metric(['gpu'], self._jetson.power['rail']['VDD_GPU_SOC']['avg'] if 'VDD_GPU_SOC' in self._jetson.power['rail'] else self._jetson.power['rail'].get('GPU', { 'avg': 0 }).get('avg'))
g.add_metric(['sys5v'], self._jetson.power['rail']['VIN_SYS_5V0']['avg'] if 'VIN_SYS_5V0' in self._jetson.power['rail'] else self._jetson.power['rail'].get('SYS5V', { 'avg': 0 }).get('avg'))
if isinstance(self._jetson.power, tuple):
g.add_metric(['cv'], self._jetson.power[1]['CV']['cur'] if 'CV' in self._jetson.power[1] else 0)
g.add_metric(['gpu'], self._jetson.power[1]['GPU']['cur'] if 'GPU' in self._jetson.power[1] else 0)
g.add_metric(['sys5v'], self._jetson.power[1]['SYS5V']['cur'] if 'SYS5V' in self._jetson.power[1] else 0)
yield g
#
# Processes
#
try:
processes = self._jetson.processes
# key exists in dict
i = InfoMetricFamily('gpu_processes', 'Process usage', labels=['process'])
for index in range(len(processes)):
i.add_metric(['info'], {
'pid': str(processes[index][0]),
'user': processes[index][1],
'gpu': processes[index][2],
'type': processes[index][3],
'priority': str(processes[index][4]),
'state': processes[index][5],
'cpu': str(processes[index][6]),
'memory': str(processes[index][7]),
'gpu_memory': str(processes[index][8]),
'name': processes[index][9],
})
yield i
except AttributeError:
# key doesn't exist in dict
i = 0
class Auth():
def __init__(self, app):
self._app = app
def __call__(self, environ, start_response):
if self._authenticated(environ.get('HTTP_AUTHORIZATION')):
return self._app(environ, start_response)
return self._login(environ, start_response)
def _authenticated(self, header):
if not header:
return False
return header == HTTP_AUTH
def _login(self, environ, start_response):
start_response('401 Authentication Required',
[('Content-Type', 'text/html'),
('WWW-Authenticate', 'Basic realm="Login"')])
return [b'Login']
if __name__ == '__main__':
port = os.environ.get('PORT', 9998)
REGISTRY.register(CustomCollector())
app = make_wsgi_app()
httpd = make_server('', int(port), Auth(app))
print('Serving on port: ', port)
try:
httpd.serve_forever()
except KeyboardInterrupt:
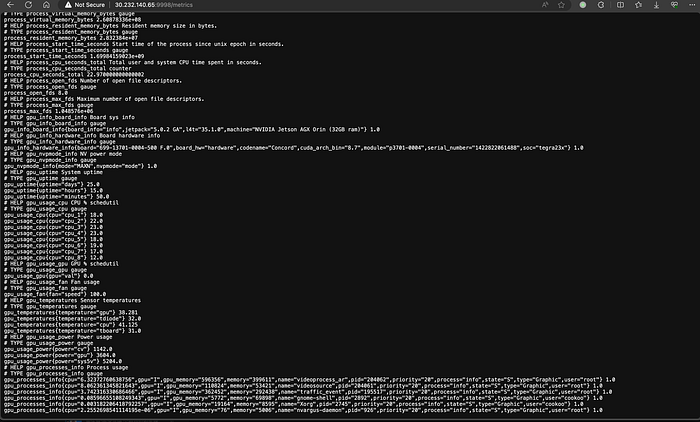
print('Goodbye!')We add basic auth to our /metrics route based username and password from env.
And get metrics:
Add Dockerfile to build the jetson gpu exporter image.
FROM python:3-buster
RUN pip install --upgrade pip && pip install -U jetson-stats prometheus-client
RUN mkdir -p /root
COPY jetson_stats_prometheus_collector.py /root/jetson_stats_prometheus_collector.py
WORKDIR /root
USER root
ENTRYPOINT ["python3", "/root/jetson_stats_prometheus_collector.py"]
Prometheus scrape the metrics
We want the prometheus have service discovery, we request kubernetes endpoint api to add endpoint, and the prometheus can scrape metrics from the service.
In the prometheus.yml, we have the following job config:
- job_name: 'edge-node-exporter'
  basic_auth:
    username: username
    password: password
  static_configs:
  - targets: ['asteria-edge-node-exporter']
  kubernetes_sd_configs:
  - role: endpoints
    namespaces:
      names:
      - citybrain
    selectors:
    - role: endpoints
      label: "name=asteria-edge-node-exporter"
  relabel_configs:
  - source_labels: [__param_target]
    target_label: instance
  - source_labels: [__address__]
    regex: '(.+):(.*)'
    replacement: '${1}'
    target_label: ip
    action: replace
        action: replace
In kubernetes, we have asteria-edge-node-exporter svc that do not have selector field.
apiVersion: v1
kind: Service
metadata:
  name: asteria-edge-node-exporter
  namespace: citybrain
spec:
  ports:
  - port: 80
    protocol: TCP
    targetPort: 80
  type: ClusterIP
Beside, we have endpoints:
apiVersion: v1
kind: Endpoints
metadata:
  labels:
    name: asteria-edge-node-exporter
  name: asteria-edge-node-exporter
  namespace: citybrain
subsets:
- addresses:
  - ip: 30.232.136.90
  - ip: 30.232.140.65
  ports:
  - name: gpu-exporter
    port: 9998
    protocol: TCP
After the setting, the prometheus will request http://30.232.136.90:9998/metrics and http://30.232.140.65:9998/metrics automatically.
If we have new mec, we can add ip to the endpoints, and the prometheus will scrape it automatically.
Show in Grafana
Now our gpu metrics in prometheus, we can config it to grafana to show it, and the final dashboard looks like in the first paragraph.
Conclusions
I am not familiar with python, so it took me lots of time to write the gpu exporter. By the cloud native service discovery, we can easily add endpoint to promethues automatically. Finally, the grafana dashboard shows perfect.